284 donors map brain ageing’s uneven path
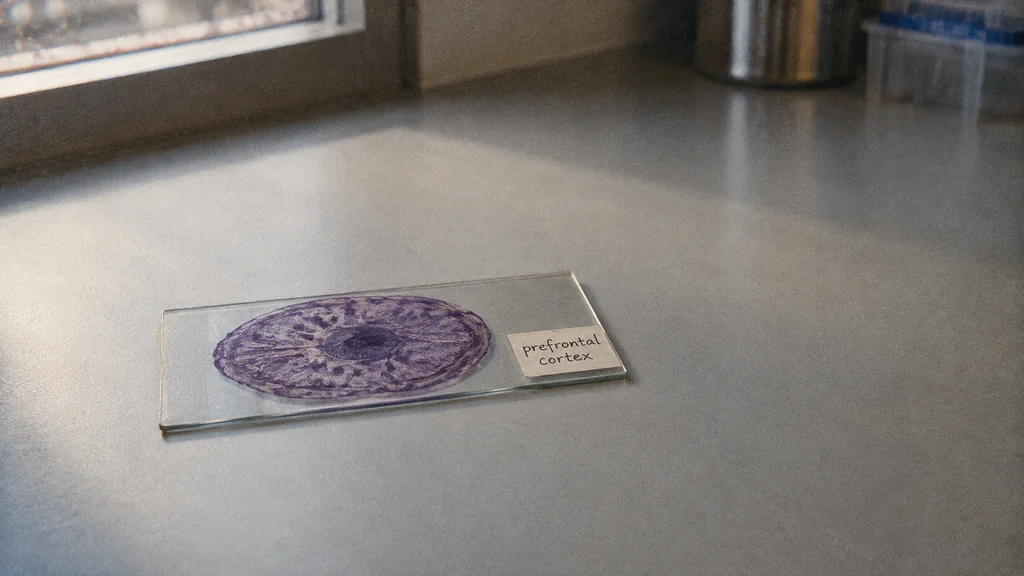
A lifespan map helps researchers separate ordinary ageing from signs of disease.
Image composition · tobriefThe patch of brain behind your forehead, which helps you plan, weigh choices and hold a phone number in mind, does not age in a straight line. Its cells differ sharply across early life, settle through adulthood, then shift again later, according to one of nine coordinated papers from an international consortium led by Mount Sinai researchers (Mount Sinai). That curve gives scientists a reference for what ordinary ageing looks like, cell type by cell type, so they can see what disease adds on top.
Picture a researcher examining brain tissue from someone who died with dementia in old age. She finds unusual activity in the brain's immune cells. Is that the disease, or is it simply how those cells behave in any old brain? Without a healthy baseline for that age, she cannot tell.
Reading a cell's to-do list
Every cell carries the same genetic cookbook, but at any moment it copies only the recipes it is using. Those working copies are RNA. Counting them gives a snapshot of what a cell was busy with when the tissue was sampled. It is evidence of activity, not a direct view of the proteins and circuits those recipes eventually build.
Older methods read the RNA from a whole chunk of tissue at once, like judging a fruit salad after blending it into a smoothie. A change confined to microglia, the brain's resident immune cells, could disappear under the much larger signal from neurons. The technique used here, single-nucleus RNA sequencing, keeps the fruit separate. Researchers pull out each cell's nucleus, which survives freezing, and read its RNA on its own.
Comparing many of these snapshots lets them sort cells into types: neurons, the support cells called glia, immune cells and blood-vessel cells. Then they can ask how each type differs between young and old brains. Cell identity dominates the picture. The Transmitter reports that cell type explained 50.5% of the measured variation in gene activity (The Transmitter).
Three acts, not a birthday
The youngest donors show the biggest differences. CSIC neuroscientist Juan Lerma told El Mundo that the RNA patterns point to glial cells being produced, synapses (the connections between neurons) being reshaped and cells being removed through programmed death (El Mundo). Those processes are an interpretation of which genes are switched on, not something anyone watched happen.
The study drew on 284 neurotypical donors aged from infancy to 97, and found that the relative proportions of most neuronal and glial subclasses become fairly stable around age 24, with exceptions (Nature). La Vanguardia turned that into a headline saying the human brain does not finish maturing until 24 (La Vanguardia). The actual finding is narrower. Because it stitches together different people who died at different ages, it describes a population trend in one region, not a date on anyone's calendar, and it says nothing about learning coming to a halt.
From roughly 60 or 65, differences return, concentrated in glial and immune cells rather than spread across the whole cortex (The Transmitter). Spanish reports linked the early-life activity to genes associated with schizophrenia and bipolar disorder, and the later glial activity to genes associated with Alzheimer's (El Imparcial). That is a match in timing between gene sets and life stages; it does not show either pattern causes illness.
Where ageing ends and disease begins
The lifespan map becomes most useful next to its larger companion. A cross-disorder atlas in the same collection profiles more than 6.3 million cell nuclei from 1,494 donors, including people with Alzheimer's disease, Parkinson's disease, schizophrenia and bipolar disorder (Nature). The nuclei count is not a head count, and the age curves come only from the healthy donors. The atlas reports some activity programmes shared across disorders and others specific to one.
Back to our researcher with the dementia sample. She can now check her immune-cell signal against how those cells typically look in healthy brains of a similar age. If the signal matches, it is probably ordinary ageing; if it departs from the curve, it becomes a candidate worth chasing.
That is what this work delivers: a reference for telling disease-associated signals apart from normal ageing in this one region of the cortex. It is a research tool, not a diagnostic test or a treatment. Laboratory and clinical experiments now have to show which of those candidate signals actually contribute to symptoms.
Details about this article
- Model:
- claude-opus-5-5
- Generated:
- 9/24/2026, 1:45:06 AM
- Pipeline run:
- eu_pipeline_20260924_005006
- Watermark:
- SynthID (Google's invisible watermark)
- Human review:
- None before publication