Europe’s 12-river flow hits record low
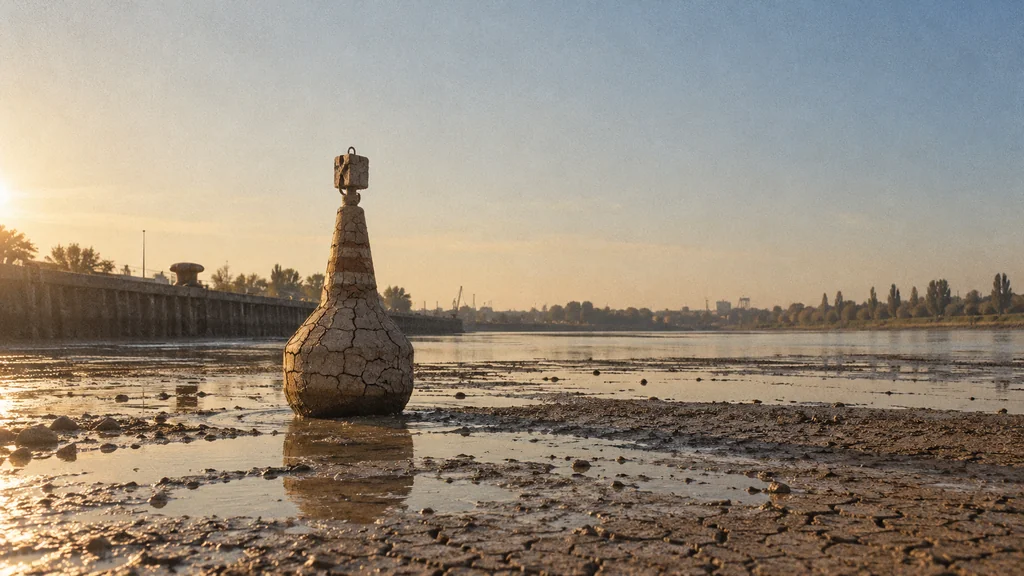
Europe’s working rivers carry less water, and their barges carry less cargo.
Image composition · tobriefWhen a river runs shallow, a cargo barge has to leave part of its load on the dock so its hull clears the riverbed. This summer, according to the EU's Copernicus climate service, the combined flow of 12 major European rivers fell to the lowest level in a model record that begins in 1992, and 52% of Europe's land reached "very strong heat stress" at some point in the season (Copernicus). Both figures are useful, and both measure something more specific than a quick reading suggests.
How you measure a river running low
Hydrologists track a river by its discharge, the volume of water passing a point each second, usually counted in cubic metres (ECMWF). Think of a garden hose. Discharge tells you how hard the water is coming out, not how much is sitting in the pipe.
Copernicus worked from computer simulations produced by the European Flood Awareness System. For each of the 12 rivers, it took the average summer discharge at the river's outlet, the point where its journey ends. It then added those 12 average rates together (Copernicus).
The result is a single reading of how strongly Europe's big rivers were flowing at their mouths, set against every earlier summer in the record. It is a model-based total for those outlets. It does not tally all the water moving across the continent over the season.
The same assessment reported record or near-record low flows on the Rhine, Danube, Po, Loire, Rhône and Seine (Copernicus). Several of these are working rivers, and this is where the hose becomes a balance sheet. A barge that has to sail lighter still pays the same crew and burns roughly the same fuel, so every tonne it carries costs more to deliver.
A heat map that measures ground, not people
The heat figure asks a different question: how hard would it be for a human body to shed heat outdoors? A breezy afternoon in the shade and a still, humid one in full sun can show the same thermometer reading and feel completely different on your skin.
The Universal Thermal Climate Index, or UTCI, captures that difference. It folds humidity, wind and the sun's radiant heat into the air temperature to estimate what the body actually experiences. On that scale, "very strong heat stress" begins at 38°C, a modelled level of bodily strain, not a reading anyone took with a thermometer (Copernicus).
To build the map, Copernicus kept only the single worst value of the summer for each patch of land. Those values came from ERA5-HEAT, a computer reconstruction of past weather conditions. So the headline describes how far the peak heat spread across the ground. It does not tell you what share of Europeans felt it, or for how many hours.
Seasonal averages tell a quieter story. In September, Copernicus reported that a defined western European region had its hottest summer on record at 21.69°C, while Europe as a whole ranked only third warmest (Copernicus August bulletin). An average blends cool spells with hot ones across a huge area, so it can sit near the top of the rankings without breaking them. The peak-heat map is built to catch the extremes that averaging smooths away.
Of the two findings, the river total sits closest to daily life. It says that, measured where they reach their outlets, Europe's major rivers carried less water this summer than in any summer since 1992 (Copernicus). Everything that depends on them, from a lightly loaded barge to the fields drawing water from their banks, had to make do with that smaller supply.
How was this article?
Help us get better
Help us get better
Details about this article
- Model:
- claude-opus-5-5
- Generated:
- 10/3/2026, 2:09:07 AM
- Pipeline run:
- eu_pipeline_20261003_005006
- Watermark:
- SynthID (Google's invisible watermark)
- Human review:
- None before publication