Germany’s power price dwarfs Sweden’s
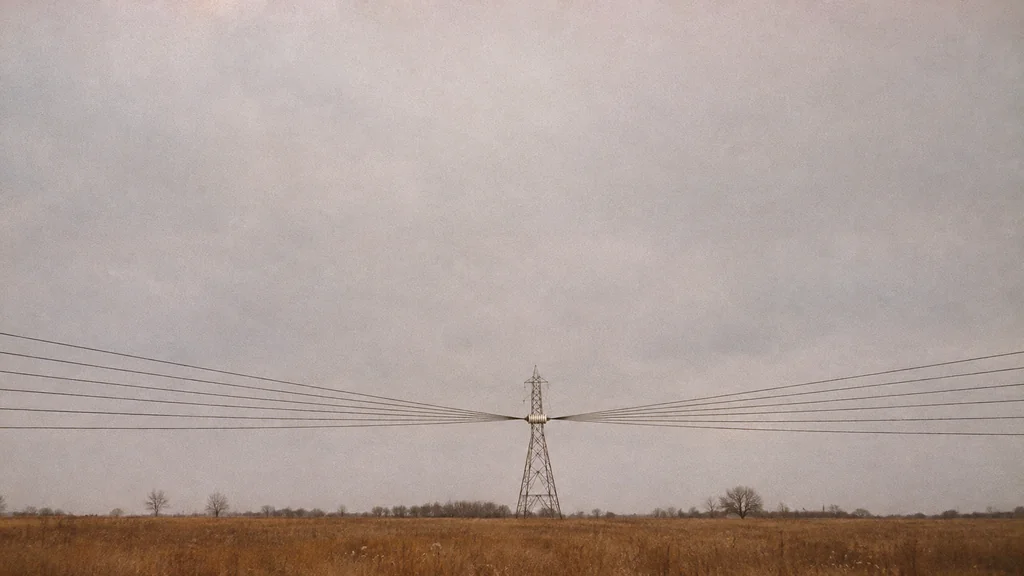
One European auction meets the narrow limits of its cables.
Image composition · tobriefWholesale electricity for delivery in Germany on Monday 9 November averaged €345.64 per megawatt-hour, the bulk unit in which power is traded (Cross-country table). In northern Sweden's SE2 price zone, the same day averaged €6.10 (Nordic–Baltic zones). Both countries trade through one linked European auction, yet their prices sat far apart.
These are day-ahead prices, set in an auction the day before delivery. They cover the energy alone, before network fees and taxes, so they are not what a household pays. Prices also moved sharply within the day: one German quarter-hour that evening cleared at €653.38 (German market report).
How one auction ends up with many prices
Europe runs this auction through market coupling. A single calculation clears every country's bids at once and lets cheap zones sell to expensive ones until the cables between them are full. Once a link hits its limit, the zones on either side clear at different prices.
Inside each zone, the costliest plant still needed to meet demand sets the price every seller receives. In much of Europe that last plant is often gas-fired, so gas prices matter. Gas was dear on Monday, with the Dutch benchmark contract at €86.50/MWh (The Guardian).
Germany also had little help from the weather. A forecast put German wind output at about 1,555 MW, just 2.3% of installed capacity (German wind forecast). That is a prediction, not a record of which plants ran or which one set the price. Power did flow in from abroad: at 17:45 Germany was importing a net 7.103 GW (German flow dashboard). Those figures show electricity crossing borders, but not which cables were full.
Where the cables run thin
Germany's western neighbours tracked it closely, with Belgium at €335.27 and France at €334.12 (Cross-country table, Belgian EPEX-derived prices). Spain sat well below that cluster, with its market operator recording €179.67 (OMIE).
The Pyrenees offer one structural clue. Red Eléctrica, the Spanish grid operator, puts the peninsula's interconnection ratio with continental Europe at 2% (Red Eléctrica). That ratio compares the capacity of cross-border cables with the country's own generating capacity, so a low figure means little room to trade. It describes a standing limit. Without flow data for Monday, it cannot show how much of the gap between Spain and France the cables caused.
The Baltics point the same way. Latvia and Lithuania averaged around €414 (Nordic–Baltic zones). A report citing the supplier Elektrum put Estonia–Latvia transfer capacity at about 900 MW during the episode (LRT). That is a plausible reason Estonia paid less than its southern neighbours, though nobody has measured how much of the difference it explains.
Who faces a wholesale spike
A wholesale price of €600/MWh equals €0.60 per kilowatt-hour, the unit on household bills, for energy alone (ACER–CEER). EU households paid an average all-in price of about €0.28/kWh in the first half of 2026, including taxes and network charges (Eurostat). These are not comparable bills. The conversion only gives a sense of scale: in Monday's priciest quarter-hour, the energy alone cost more than the average household pays per unit for everything.
The type of contract decides who meets that price. About 52% of EU household accounts are on fixed-price contracts, and 7% are on dynamic ones that follow the market interval by interval (ACER retail dashboard). Dynamic customers paid the evening peak unless they moved car charging or heating to cheaper hours. Fixed customers were shielded on the day. Whether their suppliers lost money depends on how much power those suppliers had bought in advance or hedged through contracts that lock in a price. Businesses buying at spot prices without such cover faced the peak directly.
Monday's evidence supports two conclusions. The common auction did not equalise prices across Europe when local supply differed and the links between zones had limits. And a brief wholesale peak does not establish a comparable jump in most household bills, because most households sit behind fixed contracts. One caveat applies: the figures so far do not show which specific bottleneck drove each gap. That answer lies in the grid operators' records of actual flows and cable capacity.
Details about this article
- Model:
- claude-opus-5-5
- Generated:
- 11/10/2026, 1:58:00 AM
- Pipeline run:
- eu_pipeline_20261110_005009
- Watermark:
- SynthID (Google's invisible watermark)
- Human review:
- None before publication